Candidate Drivers Analysis: Multi-Omic Search for Candidate Drivers of Functional Signatures
CaDrA is an R package that supports a heuristic search framework aimed at identifying candidate drivers of a molecular phenotype of interest.
The main function takes two inputs:
A binary multi-omics dataset represented as a SummarizedExperiment class object (where the rows are 1/0 vectors indicating the presence/absence of ‘omics’ features such as somatic mutations, copy number alterations, epigenetic marks, etc., and the columns represent the samples)
A molecular phenotype represented as a vector of continuous scores (sample-specific scores representing a phenotypic readout of interest, such as protein expression, pathway activity, etc.).
Based on this input, CaDrA implements a forward/backward search algorithm to find the set of features that together is maximally associated with the observed input scores, based on one of several scoring functions (Kolmogorov-Smirnov, Conditional Mutual Information, Wilcoxon, custom-defined scoring function), making it useful to find complementary omics features likely driving the input molecular phenotype.
For more information, please see the associated manuscript Kartha et al. (2019)
(3) CaDrA Query of BRCA YAP/TAZ Activity
(i) Load & Format Data Inputs
## Read in BRCA GISTIC+Mutation object
data(BRCA_GISTIC_MUT_SIG)
eset_mut_scna <- BRCA_GISTIC_MUT_SIG

## Read in input score
data(TAZYAP_BRCA_ACTIVITY)
input_score <- TAZYAP_BRCA_ACTIVITY

## Samples to keep based on the overlap between the two inputs
overlap <- intersect(names(input_score), colnames(eset_mut_scna))
eset_mut_scna <- eset_mut_scna[,overlap]
input_score <- input_score[overlap]

## Binarize FS to only have 0's and 1's
assay(eset_mut_scna)[assay(eset_mut_scna) > 1] <- 1.0

## Pre-filter FS based on occurrence frequency
eset_mut_scna_flt <- CaDrA::prefilter_data(
  FS = eset_mut_scna,
  max_cutoff = 0.6,  # max event frequency (60%)
  min_cutoff = 0.03  # min event frequency (3%)
)
(ii) Run CaDrA
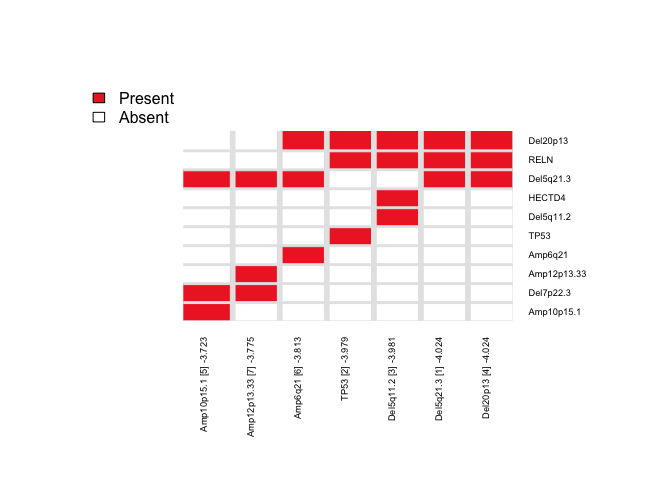
Here, we repeat the candidate search starting from each of the top ‘N’ features and report the combined results as a heatmap (to summarize the number of times each feature is selected across repeated runs).
IMPORTANT NOTE: The legacy function topn_eval() is equivalent to the recommended candidate_search() function
topn_res <- CaDrA::candidate_search(
  FS = eset_mut_scna_flt,
  input_score = input_score,
  method = "ks_pval",          # Use Kolmogorow-Smirnow scoring function
  weight = NULL,               # If weights is provided, perform a weighted-KS test
  alternative = "less",        # Use one-sided hypothesis testing
  search_method = "both",      # Apply both forward and backward search
  top_N = 7,                   # Evaluate top 7 starting points for each search
  max_size = 7,                # Maximum size a meta-feature matrix can extend to
  do_plot = FALSE,             # Plot after finding the best features
  best_score_only = FALSE      # Return meta-feature set, observed input scores and calculated best score
)
(iii) Visualize Best Results
## Fetch the meta-feature set corresponding to its best scores over top N features searches
topn_best_meta <- CaDrA::topn_best(topn_res)

# Visualize the best results with the meta-feature plot
CaDrA::meta_plot(topn_best_list = topn_best_meta, input_score_label = "YAP/TAZ Activity")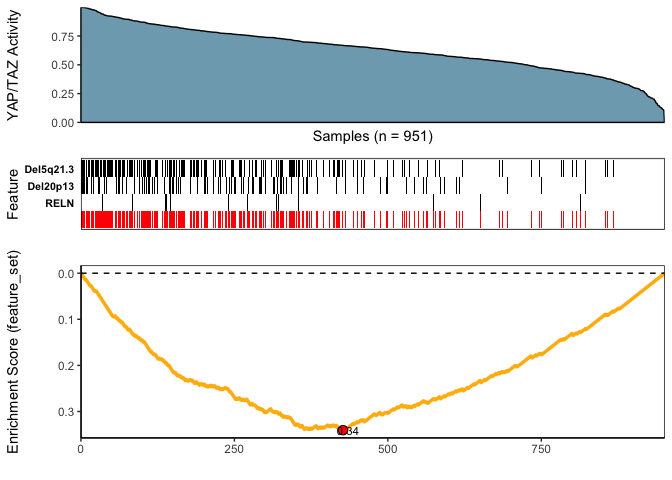
(4) SessionInfo
sessionInfo()
R version 4.2.3 (2023-03-15)
Platform: x86_64-pc-linux-gnu (64-bit)
Running under: Ubuntu 22.04.2 LTS

Matrix products: default
BLAS:   /usr/lib/x86_64-linux-gnu/openblas-pthread/libblas.so.3
LAPACK: /usr/lib/x86_64-linux-gnu/openblas-pthread/libopenblasp-r0.3.20.so

locale:
 [1] LC_CTYPE=C.UTF-8       LC_NUMERIC=C           LC_TIME=C.UTF-8
 [4] LC_COLLATE=C.UTF-8     LC_MONETARY=C.UTF-8    LC_MESSAGES=C.UTF-8
 [7] LC_PAPER=C.UTF-8       LC_NAME=C              LC_ADDRESS=C
[10] LC_TELEPHONE=C         LC_MEASUREMENT=C.UTF-8 LC_IDENTIFICATION=C

attached base packages:
[1] stats4    stats     graphics  grDevices utils     datasets  methods
[8] base

other attached packages:
 [1] CaDrA_0.99.2                SummarizedExperiment_1.28.0
 [3] Biobase_2.58.0              GenomicRanges_1.50.2
 [5] GenomeInfoDb_1.34.9         IRanges_2.32.0
 [7] S4Vectors_0.36.2            BiocGenerics_0.44.0
 [9] MatrixGenerics_1.10.0       matrixStats_0.63.0

loaded via a namespace (and not attached):
 [1] Rcpp_1.0.10            lattice_0.20-45        gtools_3.9.4
 [4] digest_0.6.31          foreach_1.5.2          utf8_1.2.3
 [7] R6_2.5.1               plyr_1.8.8             evaluate_0.20
[10] highr_0.10             ggplot2_3.4.1          pillar_1.8.1
[13] gplots_3.1.3           zlibbioc_1.44.0        rlang_1.1.0
[16] misc3d_0.9-1           R.utils_2.12.2         R.oo_1.25.0
[19] Matrix_1.5-3           rmarkdown_2.20         labeling_0.4.2
[22] stringr_1.5.0          RCurl_1.98-1.10        munsell_0.5.0
[25] DelayedArray_0.24.0    compiler_4.2.3         xfun_0.37
[28] pkgconfig_2.0.3        htmltools_0.5.4        tcltk_4.2.3
[31] tibble_3.2.0           GenomeInfoDbData_1.2.9 ppcor_1.1
[34] codetools_0.2-19       fansi_1.0.4            withr_2.5.0
[37] MASS_7.3-58.2          bitops_1.0-7           R.methodsS3_1.8.2
[40] grid_4.2.3             gtable_0.3.1           lifecycle_1.0.3
[43] magrittr_2.0.3         scales_1.2.1           KernSmooth_2.23-20
[46] cli_3.6.0              stringi_1.7.12         farver_2.1.1
[49] XVector_0.38.0         reshape2_1.4.4         doParallel_1.0.17
[52] vctrs_0.6.0            iterators_1.0.14       tools_4.2.3
[55] R.cache_0.16.0         glue_1.6.2             parallel_4.2.3
[58] fastmap_1.1.1          yaml_2.3.7             colorspace_2.1-0
[61] caTools_1.18.2         knitr_1.42