By utilizing the top N results obtained from candidate_search(),
we can find the best meta-feature among the top N searches using
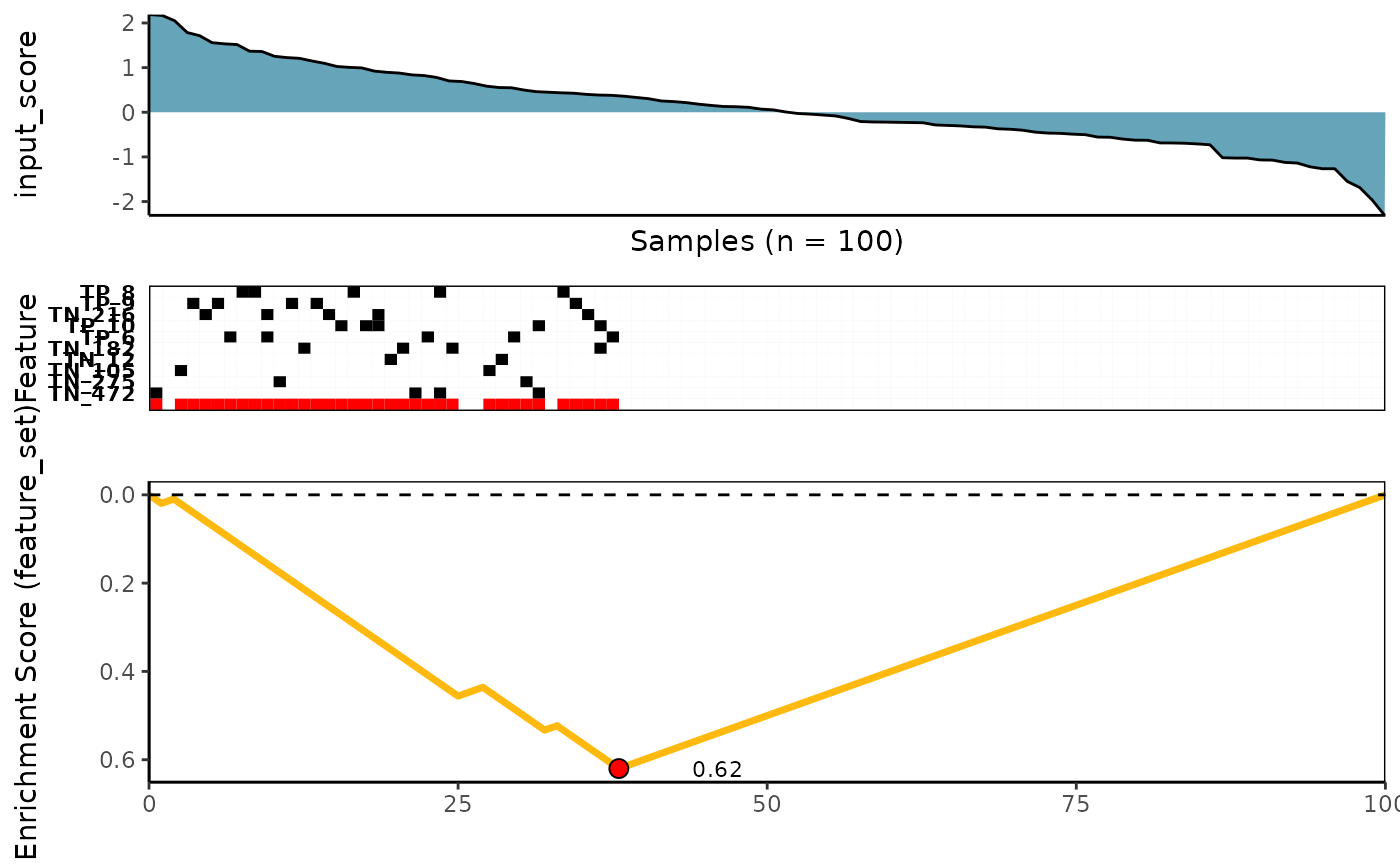
topn_best(). meta_plot() is then used to produce graphics
including a tile plot for the top meta-features that associated with a molecular
phenotype of interest (e.g. input_score), the KS enrichment plot of the meta-features,
and lastly, a density diagram of the distribution of the observed
input scores sorted from largest to smallest at the top.
meta_plot(topn_best_list, input_score_label = NULL)Arguments
- topn_best_list
a list of objects returned from
candidate_search()corresponding to the search of a set of top N features given by top_N value. The topn_best_list contains a list of returned meta-feature set, its corresponding best score, and observed input scores.- input_score_label
a label that references to the
input_scorevariable that was used to compute the top N best features. Default isNULL.
Value
a density diagram of observed input scores (sorted from largest to lowest), a tile plot of the top features within the meta-feature set, and a KS enrichment plot of the meta-feature set for a given distribution (here, this will correspond to the logical OR of the features)
Examples
# Load pre-computed Top-N list generated for sim_FS dataset
data(topn_list)

# With the results obtained from top-N evaluation,
# We can find the combination of features that gives the best score in
# top N searches
topn_best_meta <- topn_best(topn_list = topn_list)

# Now we can plot this set of best meta-feature
meta_plot(topn_best_list = topn_best_meta)