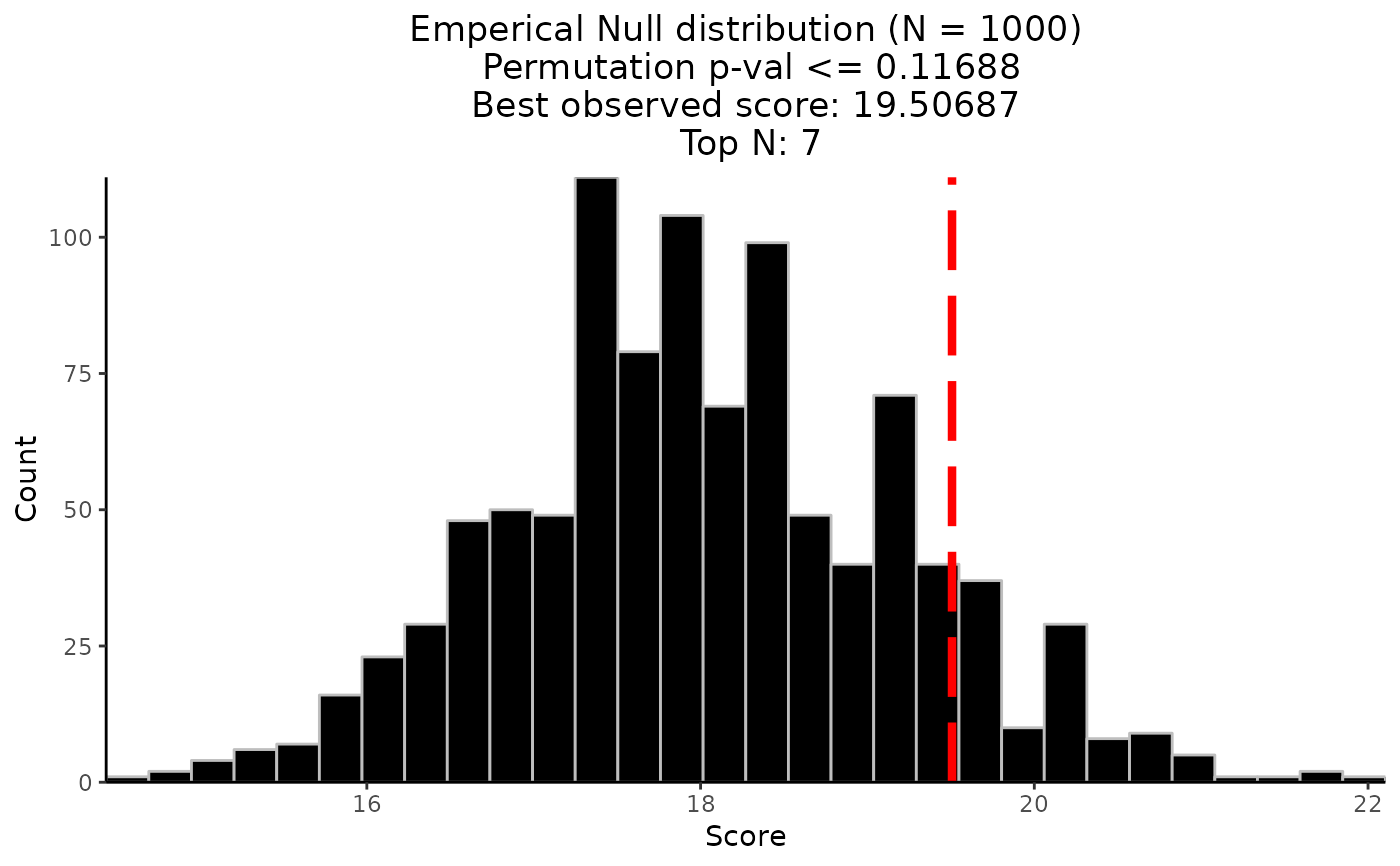
Plot the Empirical Null Distribution of Permutation Best Scores returned from CaDrA() function
permutation_plot(perm_res)Arguments
- perm_res
a list of objects returned from
CaDrA()function. The returning object contains a list of key parameters that are used to run the permutation-based testing, a vector of permuted best scores for a givenn_perm, an observed best score, and a computed permutation p-value.
Value
a density plot
Examples
# Load pre-computed permutation results
data(perm_res)

# Plot the permutation results
permutation_plot(perm_res)
#> `stat_bin()` using `bins = 30`. Pick better value with `binwidth`.