A list of objects returned from candidate_search() using simulated dataset
FS = sim_FS, input_score = sim_Scores, top_N = 7,
method = "ks_pval", alternative = "less",
search_method = "both", max_size = 10,
and best_score_only = FALSE as inputs to the function.
NOTE: max_size is set to 10 as we would like to account
for the presence of 10 left-skewed (i.e. true positive or TP) features
in sim_FS dataset.
data(topn_list)Format
A list of objects returned from candidate_search() including
a set of meta-features in form of SummarizedExperiment objects,
its observed input_score, and corresponding best score pertaining to each
top N feature searches.
See candidate_search for more information.
Details
Over top_N = 7 feature searches, a set of meta-features in form of SummarizedExperiment object, along with a vector of observed input scores and its corresponding best score are returned from each search.
References
Kartha VK, Kern JG, Sebastiani P, Zhang L, Varelas X, Monti S (2019) CaDrA: A computational framework for performing candidate driver analyses using binary genomic features. (Frontiers in Genetics)
Examples
# Load pre-computed Top-N list generated for sim_FS and sim_Scores dataset
data(topn_list)
# Fetch the first meta-feature
topn_list[[1]]$feature_set
#> class: SummarizedExperiment
#> dim: 10 100
#> metadata(3): experimentData annotation protocolData
#> assays(1): exprs
#> rownames(10): TN_716 TN_108 ... TN_620 TN_542
#> rowData names(2): Feature Type
#> colnames(100): 1 2 ... 99 100
#> colData names(0):
# Fetch the second meta-feature
topn_list[[2]]$feature_set
#> class: SummarizedExperiment
#> dim: 10 100
#> metadata(3): experimentData annotation protocolData
#> assays(1): exprs
#> rownames(10): TP_8 TP_9 ... TN_275 TN_472
#> rowData names(2): Feature Type
#> colnames(100): 1 2 ... 99 100
#> colData names(0):
# Retrieve the meta-feature with the best score among top_N = 7 runs
topn_best_meta <- topn_best(topn_list = topn_list)
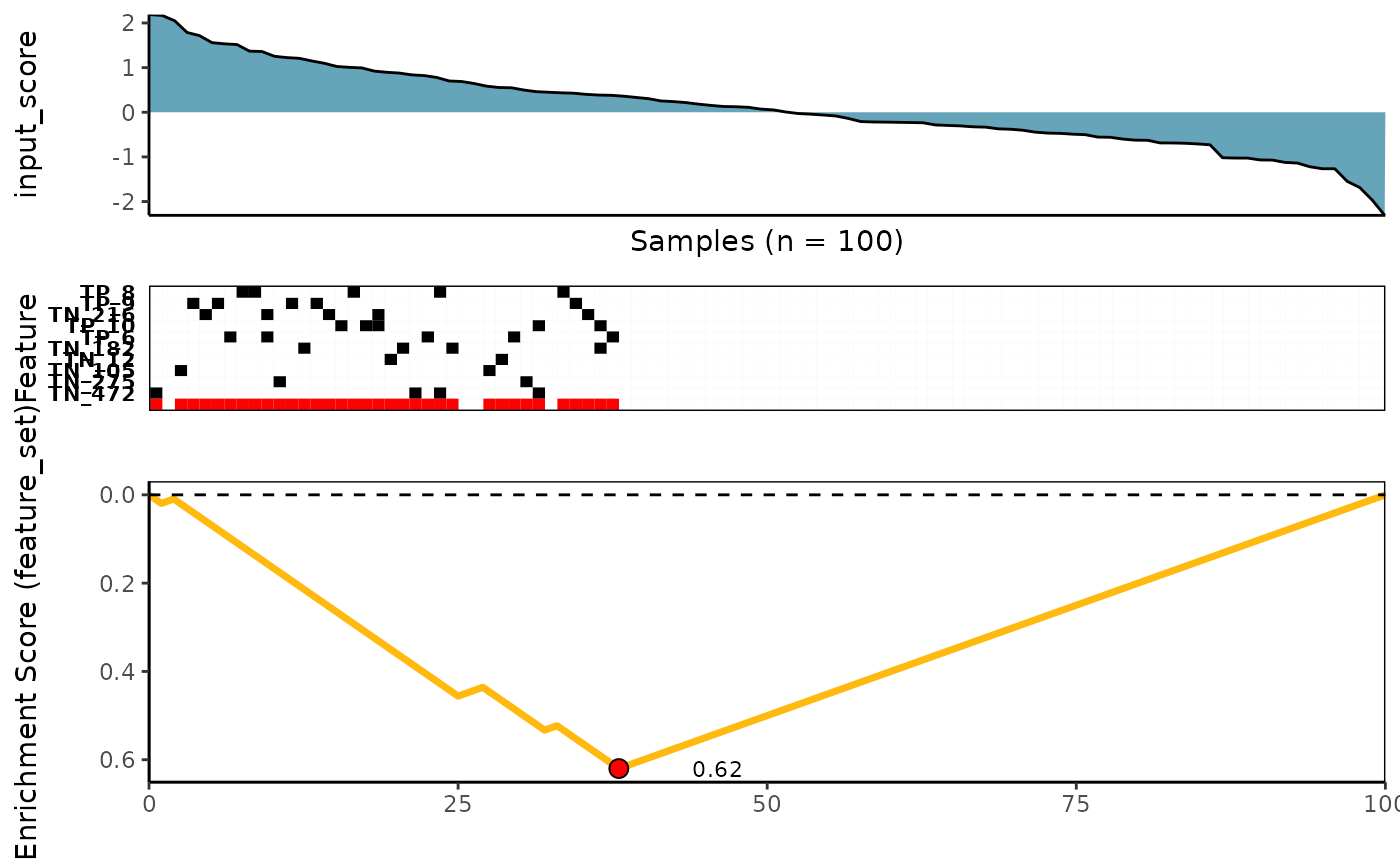
# Visualize the best meta-feature using meta_plot() function
meta_plot(topn_best_list = topn_best_meta)
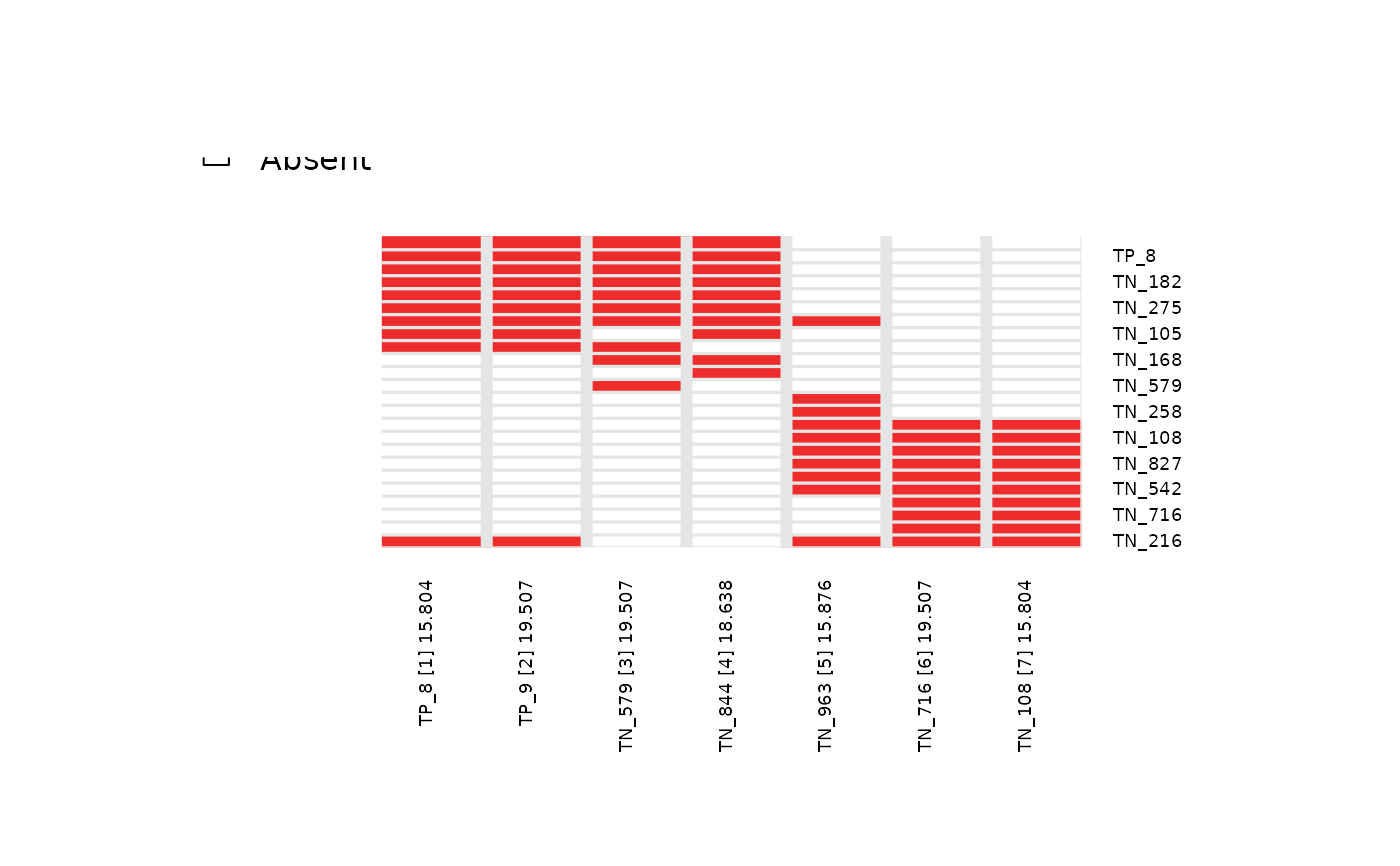
 # Visualize overlap of meta-features across top_N = 7 using topn_plot() function
topn_plot(topn_list = topn_list)
# Visualize overlap of meta-features across top_N = 7 using topn_plot() function
topn_plot(topn_list = topn_list)